Research Article:
What Makes a STEM Student
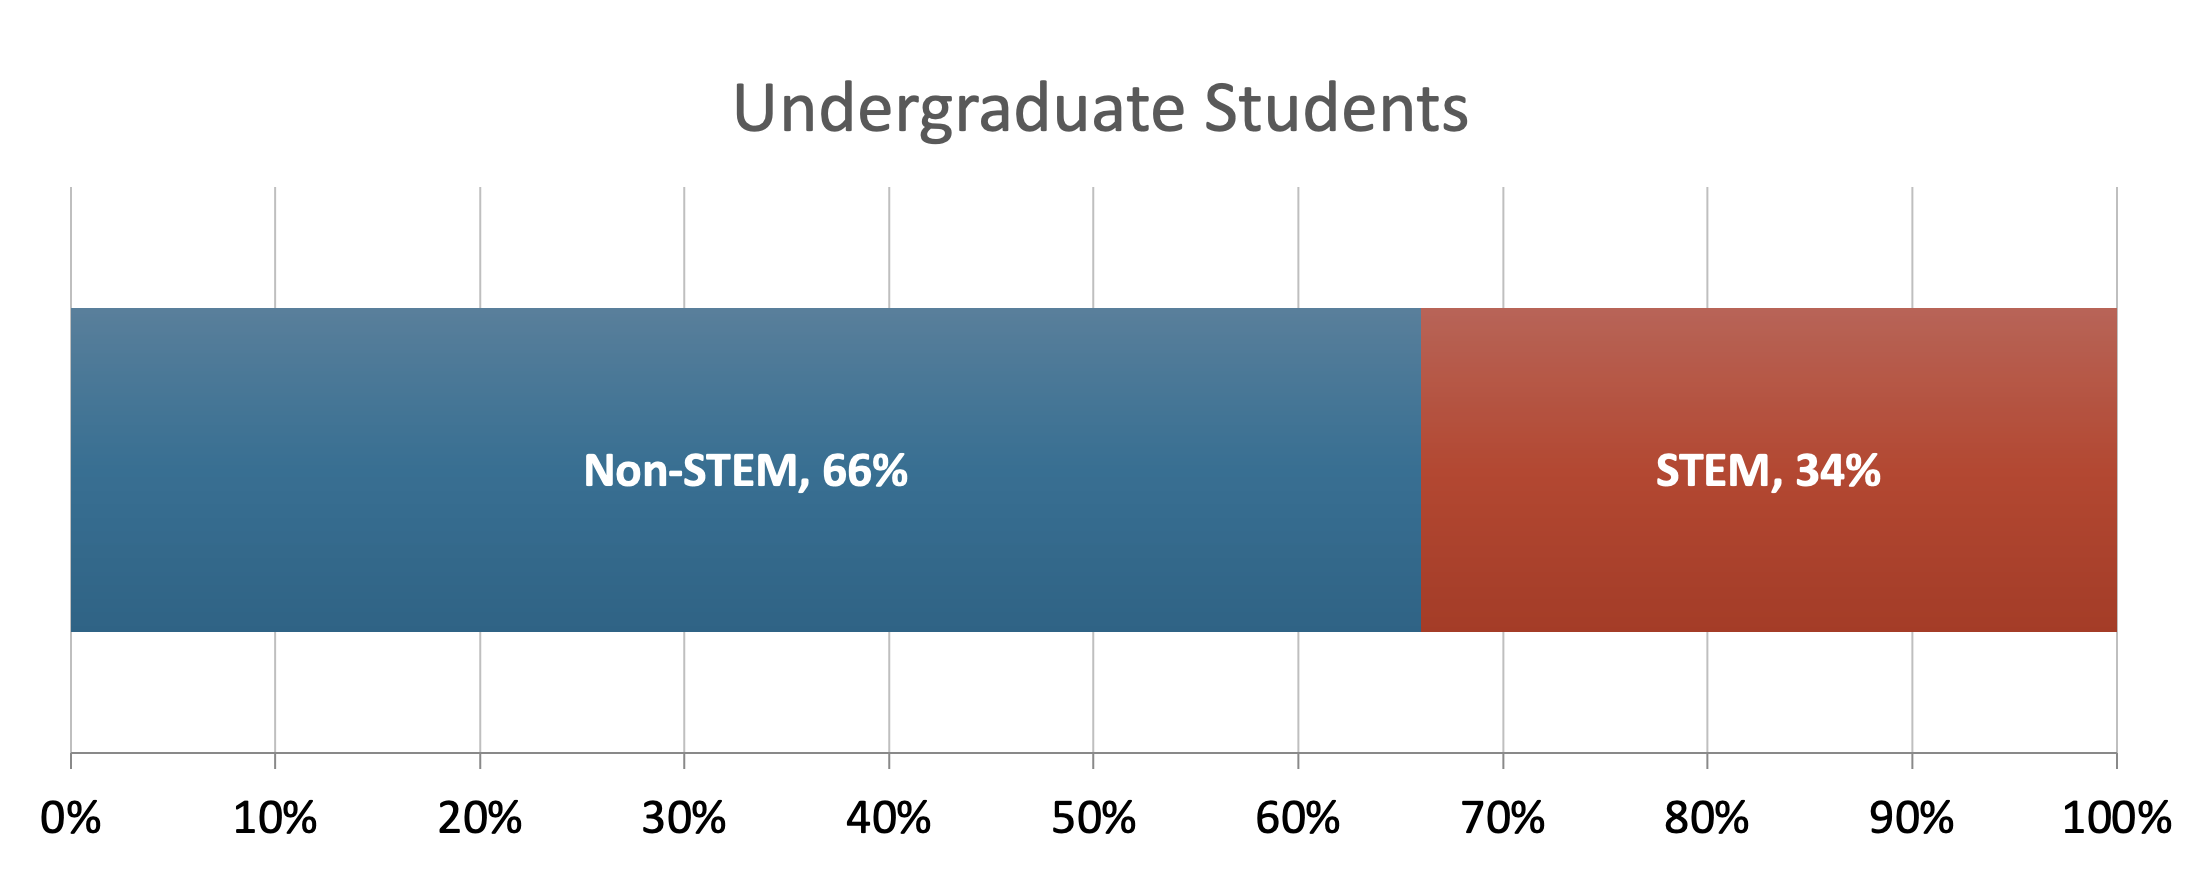
Isabel Elaine Allen, Bay View AnalyticsAcross the country, the number of STEM majors is increasing. In a recent representative sample of undergraduate students from the Fall 2022 semester, just over one-third of students indicated they were, or planned to be, majoring in a STEM discipline.
Are there unique attributes to these one-third STEM students, compared to non-STEM students? We can start to answer this question using data from the Digital Learning Pulse Survey. We investigated the demographics of current STEM students using the representative sample of 2,358 college students collected during the Fall of 2022. Indeed, we found that there are differences in the underlying attributes of STEM and non-STEM students.
The overall statistics for STEM students show some differences in school size and type compared to non-STEM student but not for age or gender. The mean and median ages of students in STEM compared to non-STEM majors are equivalent, but female STEM majors are, on average, 2 years older than their male STEM counterparts. STEM majors are more likely to attend a larger school. The gender of the student mimics the overall percentage of STEM majors with males representing 62% of STEM majors. Within STEM majors, 80% indicate they attend a public college or university, compared to 86% of non-STEM majors.
There are also some differences in by race for students. Among self-identified race, Asians are significantly more likely to major in STEM (58%) when compared to Hispanics (32%), Blacks (33%), Whites (33%), and Other (29%).
Interestingly, the STEM majors can be characterized by their political identification. There are a greater number of STEM majors identifying as independent voters (55%) compared to non-STEM majors (49%). No differences are seen in voter registration, with almost 70% of STEM and non-STEM majors registered to vote.
Putting all these factors and covariates together, we can understand more about gender differences in STEM. We performed a statistical model predicting the demographics of students majoring in STEM. These variables highlight the largest differences between STEM and non-STEM students over the whole population of students. For male students, only identification as Asian is a significant predictor variable. For female students, age, identification as Asian, and political identification as Independent are also important variables.
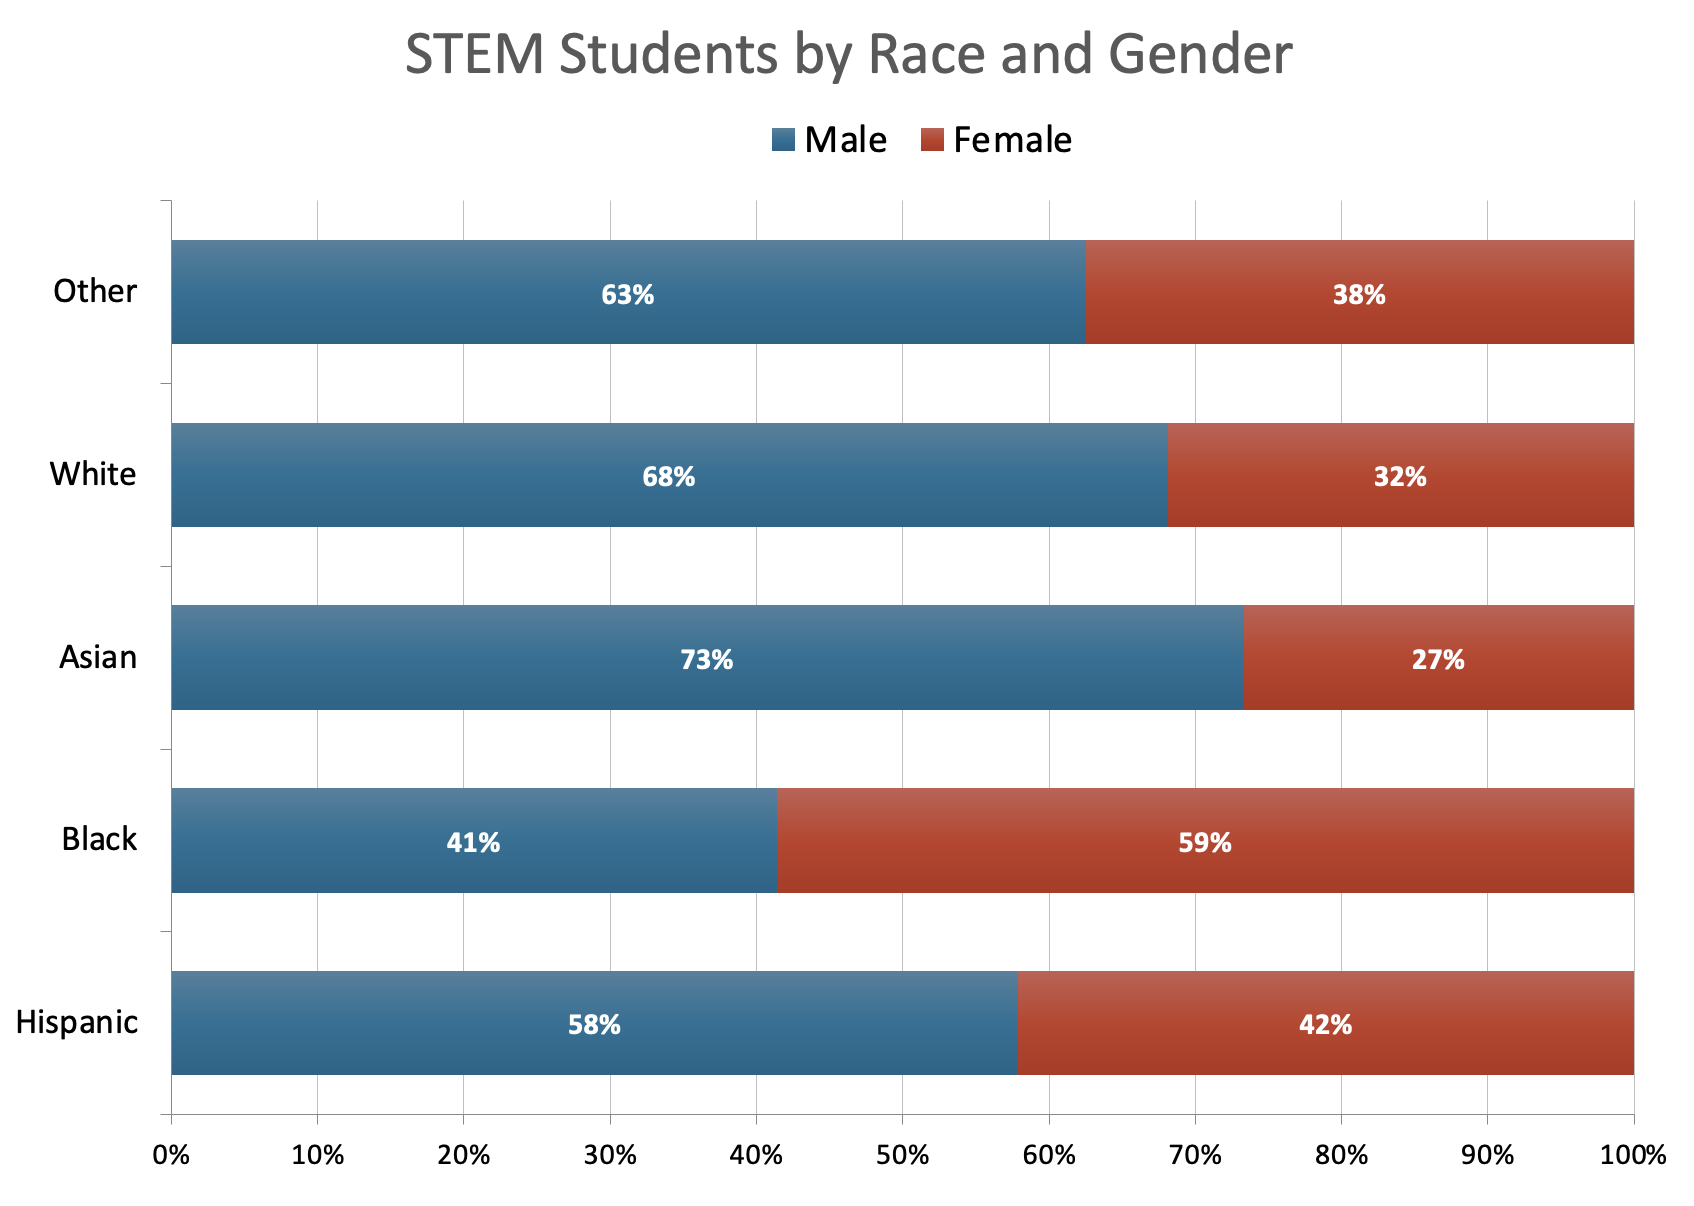
Within STEM students, there are differences in demographics. We have previously mentioned that female students tend to be older than their male counterparts. Additionally, when looking at both self-identified race and gender, there are some big differences. Overall, there tends to be more male than female students, with the greatest differences between genders in White and Asian students. However, Black students have more female students than male students.
Overall, STEM students make a substantial portion of all undergraduate students. Our research suggests that STEM students have unique attributes compared to non-STEM students. These differences may be important to keep in mind for institutions creating support programs specifically targeting STEM students, or recruitment efforts to support underrepresented groups in STEM.
As the number of STEM students grow, future research will help show how this population of students may evolve. Will they be similar to STEM students right now? What are the goals of future STEM students? How can institutions best support this group?
The Digital Learning Pulse Survey is an ongoing research project conducted by Bay View Analytics in partnership with Cengage, the Association of Community College Trustees (ACCT), Phi Theta Kappa (PTK), and College Pulse. More information is available here.
Recent Publications
Digital Learning Pulse Surveys
- Infographic: 2023-2024 Digital Learning Pulse Survey
- The Digital Transformation of the Community College
- Planning for a Smaller Future: Dealing with Declining Enrollments
Course Material Affordability
- Pennsylvania Course Materials Survey 2023
- Pennsylvania Course Materials Presentation
- Course Material Webinar Slides
Open Educational Resources
- Digitally Established: Educational Resources in U.S. Higher Education, 2023
- Curricula of Many Sources: Educational Resources in U.S. K-12, 2023
- Research Brief: Digital and OER Textbook Adoption
- Research Brief: Faculty Satisfaction with Course Materials varies by Publisher
STEM
- Teaching Online: STEM Education in the Time of COVID
- What Makes a STEM Student
- Perceptions of the Future of STEM Education
Distance Education
- Digital Faculty: Faculty Social Media Use and Communications
- Infographic: Digital Faculty
- Grade Increase: Tracking Distance Education in the United States
Follow us on
Privacy
All survey respondents are provided complete anonymity. No personally identifiable information is released. Full privacy policy.